Listen & Subscribe
Listen & Subscribe


Listen & Subscribe
SUBSCRIBE & REVIEW ON


SHARE THIS PODCAST


There is a lot to be learned from a view of Earth from space; the difficult part is translating that information into something that is useful and applicable to the problems we’re facing on the ground. Benjamin Koetz is a scientist with the European Space Agency who spends his days monitoring Earth from space and determining how best to apply what he’s learning to solve practical issues.
For instance, he is able to identify dramatic changes correlated with the death of crops due to lack of rainfall in certain geographical regions, compare these changes over time, and use this information in food security intervention efforts, such as by informing farmers of specific irrigation needs. Among other topics, Koetz discusses observation techniques, the effects of climate change, environmental trends that are identifiable from space, and the long-term goals of his work.
Press play to hear the full conversation and search the web for live-streaming satellite videos.
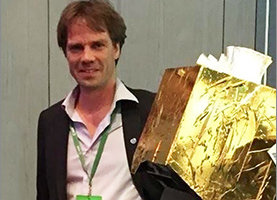
Richard Jacobs: Hello, this is Richard Jacobs with the FutureTech and FutureTech Health Podcast and I have Benjamin Koetz the science applications and climate department earth observation programs at ESA (European Space agency) Benjamin, thanks for coming. How are you doing today?
Benjamin Koetz: I’m good. Thanks for inviting me.
Richard Jacobs: When I think about ESA and the other agencies, I know somehow, I guess I always think of them going out and space, observing, you know, other planets and everything. But is your focus more observing things that are happening on the earth from space, from Orbit or what’s your focus at ESA?
Benjamin Koetz: Well, ESA it’s a very advanced space agency who is covering all the different spaces aspect, which you can think of and yes basics the exploration as one of the most visible ones. But at the European Space Agency, the biggest director, just the earth observation, trying to observe our little blue marble and trying to understand how it functions and the information continuously monitoring the different processes coming from what is happening on earth, on the nature, but also the activities of us people in this kind of ecosystems that next, It quite exciting to watch that.
Richard Jacobs: Yeah. So what kind of observations or you know, in charge of, or what are you focusing on in particular? What are you observing about the earth?
Benjamin Koetz: All right. So my position is called the application scientists, which means nothing in the first place actually has to purpose of interacting application and signs, making sure that the Earth Observation Signs is somehow related to and useful applications on the ground. Meaning that information from the satellite is being concentrated into something which is useful in managing our natural resources. So that could be all kinds of things ranging from agriculture type of monitoring up to slot a disaster monitoring applications. So that is the type of range where we look at and there’s a number of different types of observations and they can go through the different techniques which we were using, which is optical up to microwave access or passives graders got there, means the technology is not the driver, it’s more what type of information can be used by people on the ground to make their, let’s say operation is and their applications more informed and more efficient.
Richard Jacobs: So in particular, what is the focus of the observations? Are we looking at how forests are changing on the earth or how water is moving or changing? Or is it climate observations or all those things, you know, what are some particular?
Benjamin Koetz: Yeah, in general, I mean the big advantage of earth observation by satellites is that you have a global view and about what things are changing. And as you said, changes are the most interesting one. It’s a really is what if a forest is being cut sometimes, in a normal process for us companies owning and managing the forest. In some cases, it’s a Negro cutting and some cases damage from a storm and all these kinds of changes you would like to see because it’s a resource which is valuable. Forest has Biomass as well it has value also in an economical sense. You would like to follow that and to see how it’s been used in the context of climate change.
Forest is a carbon thing. So you also want to see how that is changing. Is it diminishing or increasing? And there’s even a seasonal change over the seasons and over the years as well. And all that is something which you can see from space and the global scale. And that, you have the temporal and spatial dimension is an interesting part that you can combine if the base and link it to.
Richard Jacobs: What are some of the big trends that we’re seeing through observation? Anything interesting or good or bad?
Benjamin Koetz: That’s a difficult question. And the climate change context, that is certainly something that you can very quantitative measure focused on the CIS is the dimensioning and the alarming scale. That certainly is something which has been observed by both European Space Agency but also from other states. And it is something which is absolutely alarming.
Richard Jacobs: Well, you know what I want to ask you like what have you seen with your own eyes where you’ve looked at imaging data, you, you, yourself, what have you seen that stood out to you or surprised you? You know, we all hear about scientists see this are scientists, you know, claim this, but you know, you being one of them. What have you seen literally and looking at data at images?
Benjamin Koetz: me personally, I’m focusing on not an agriculture context. And there you see a lot of changes going on in terms of and responding to a lack of voters. For example, we have observed in the north and Europe last summer for example, that suddenly all the crops and had dying from lack of rainfall, precipitation. And that was something which was associated directly to climate change variability that we see. If you look at these images, you compare from one year or even from the month beforehand and even with your bare eyes basically and see in turning from green to Brown and which you see on the ground in one hand side. But even, if you look at under the whole continent and they really can quantify this kind of impact is quite, well, it’s alarming to, to make the link to this lust in terms of harvest and to basically, meetings, they really can quantify this kind of impact is quite well, it’s alarming to, make the link to this lust in terms of harvest and to basically,
Richard Jacobs: Yeah, I’ve heard just anecdotally in the news and I’ve seen also, you know, for instance, I live in Texas and when we arrived here like five years ago, there was a drought for many years in one particular area. And then there was so much rain at the drought, completely was reversed. And yeah, the local lake was filled up. It was like 80 feet down and it was filled all the way off, which was really dramatic. And I know, for instance, you know the US but in southern California, there was a drought for years and years and years. And you know, I personally observed all the vegetation dying along the side of the highways. And you know, I remember my wife said, when it rains, everything is getting, you know, Mudslides and all that. And she was right. You know, it just started happening, and I’ve heard an X number of years ago about, you know, Europe and central Europe and Asia having a winter where the temperature didn’t get above zero Fahrenheit, you know, negative, see for weeks and weeks. So I’ve seen and observed a lot of that, you know, extreme climate events. I wanted to see what you’ve observed and seen and you know, how that affected you.
Benjamin Koetz: I mean the most one example I just brought up, but we can have a climate change initiative as well, bringing this into context, over 30 years and that is much more fundamental scientific terms. But as you said, the real impact on, on individually like, like your wife is it’s about having access to the water in say the next water pound and on the field where you grow your crops and then we have been working for example in Mali, one thing what is happening in California in terms of royalty, sort of an infrastructure around but then also doing this kind of things and there are people live depending on the field and that’s also something that you can directly follow from the satellite what is happening and with that awesome linking it to food security type of interventions. And that’s certainly important when it comes down to people who are, they’ve WSP divert food program, who was, who was and organizing them, put security emergency intervention on the ground and they need to decide what place to go first and how much I have to plan two or three months in advance. This is the type of thing, the second they’d image can make a difference and affected life in, in a, in a pragmatic way.
Richard Jacobs: Well, it’s, um, I mean there’s really nothing we can do about the weather, but are you able to observe patterns, you know, from space that we can see on the ground? To help people, let’s say, you know, I live in a certain place and we’re hit with a drought this season and obviously, I really want to know will that be the end of the drought or will they continue for how many more years? You know, is there any way with observational data for you to do better-predicting trend wise, you know, even to look at again, just large trends and to tell farmers in certain areas or people that live in certain areas what’s coming or when things will end or is it really unpredictable?
Benjamin Koetz: I mean that is by predicting as one thing, forecasting is another. If you have, something that you did, you switch on your television every day. And, I’m not an expert in weather forecasts itself, but what I am always been told, 60% of the information which goes into the weather forecast is coming from satellite notes. Otherwise, that forecast accuracy and the probability would be much lower than other what we have today. So that is we do see global and regional patterns in terms of the weather formations moving along over our globe, which would not be able to be done in the same way as a from ground stations. And that is also coming from the geostationary satellites, their creature giving us every 15 minutes observations over the full of Globe and satellite tag that from North over the United States. But there are also from all the European side of the European African side of the hemisphere and these all together the test data being exchanged between the different agencies to make sure that the weather forecast more predictable or more venerable and patterns which would never see from the ground.
Richard Jacobs: So what are some interesting patterns like macroscopic patterns going on that we’ve been able to observe now with our satellite coverage observed?
Benjamin Koetz: For example, that’s another topic, but it’s a clear pattern that you see in terms of increased sea surface temperature. That is something which you can always see in connections with different phenomena, which is currently not very active, but it was a year ago and it was quite active in that is something that you could link for example, over the global distribution of collieries. Now you’d see clear trends of increased of source, sea surface temperature affecting and that then affecting the collieries and make them also dye bleach and then also losing the symbol. This within that is a very ongoing trend and it has been also documented by the IPTC reports on the climate change community.
Richard Jacobs: Right, and then in terms of, you know, the work you’re specifically involved in, what’s, what’s your goal? Is your goal to focus on agriculture and study what’s happening with it and how to improve it or what’s your specific goal or the agency?
Benjamin Koetz: Our goal basically is on one hand side to develop the right technologies and that is really the earth observation, tripled technologies and in the response to make sure that these technologies fit to the information needs on the ground and so I give you a very specific example in this case and the context of agriculture is actually irrigated in many cases. If you look you, I think you sit in Texas, right and you have the focus of the condole but still in the Midwest of the United States you have a lot of corn being grown, which is normally irrigated and that in most cases, 70% of the freshwater, which is the not available by the evapotranspiration coming out after the coming from the truck. That needs to if he can measure that in a consistent and operation and then we can give the farmer some information about how much water was lost and how much.
Then the next thing he needs to the plant by irrigation into that, which has a firmer from Burma and to measure the density of temperature, that also conflates two evapotranspiration. And in that is done a hundred-meter resolution, which is suitable for the size of the field if you’d want to do that. A few of them, much smaller. So what we do at the moment is developing, which is doing exactly the same type of observation and the Thermal wave links, it’s about 50-meter resolution, which is four times as high, a little shimmer. This existing in the moment in which we could respond to increasing water scarcity in Europe and in European production. I mean, one example is how to be developed technology and translated into information that could use and by farmers in this case.
Richard Jacobs: And what’s the resolution, what’s the smallest feature size can they see?
Benjamin Koetz: And then in the optical, they’re different veins.
Richard Jacobs: I’m just thinking about the visual spectrum, what spectrums are you imaging in and what’s the resolution and the different spectrums. And you know, what do you see by looking at the different spectrums?
Benjamin Koetz: Okay. The most of the natural way is there’s a commercially available, we go down to 30 centimeters. That is a very high resolution and satellite, which is not giving on a consistent level the global coverage every day or it’s sampling the earth only and then you have satellites which actually are observing every day. If we need to have a resolution and finding it’s still commercial and funding. Then we have satellites which focus on the European Space Agency or another building for open free access. Then the range of 10 to 13 with the devotion that’s in the optical and good like to look into other aspects. For example, Thermal that we talk about 50 to 100 meters and in many cases, one Kilometer resolution energy use NOAA, which we have a ceiling at the satellite, it’s more difficult who have higher resolution information.
And then finally, which is also very interesting, is the micro-region and very, you need to have raider or instrument, which can give you information up to 10-meter resolution as well. They all have different applications. If I give you an example for the SAB, for example, it’s very sensitive to water surface versus a NANT. So you could very easily observe the recently flooded area and that you can do even through flows colluded and explodes, colluded atmosphere, which normally happens when you flood that, that’s very particular for the, for that type of observation.
Richard Jacobs: What kinds of, whether we’d get in the way in this cloud cover that’s essentially water in the way of you observing the surface. Right?
Benjamin Koetz: Right. Yeah. Which is basically for the optical, I mean, you’re blocked. There’s no way how to look through it. But the microwave, information has a longer wavelength and can, is not affected by the way water vapor. So it looks, yeah basically through the clouds and holds to still observe be nowhere, completely cloud covered area to the length of the wavelength related to the smallest, very small size of the water or it’s not in a vapor form if not being affected.
Richard Jacobs: The microwave is visual or thermal any other observation bands?
Benjamin Koetz: In the relatively new type of application and observation which is called mazes that can be the active observation. We will send out likes and codes and then you received this then active in data information signal back. So that’s a system, based on lasers and that can be used either to measure the atmospheric composition but also and what has been just now launched by JPL on, on the International Space Station and in neither system which can measure the height of the surface, the earth’s surface, but also even distinguish between the surface of tree canopy.
And that gives you the tree height for and then you get to the free dimension of a presentation of the surface, which is a completely different type of observation, which I have not ever switch is complementing the other type of observations.
Richard Jacobs: I just see the holy grail for the space agency, wouldn’t would it be, I mean, maybe we can image the entire earth and piece together enough satellite feeds to see literally the entire earth all at once and over time.
Benjamin Koetz: It certainly is in the moment a big push for getting more information and the continuous and they have been getting information, let’s say every week, every month or so. But there’s a huge push now to really have the 10% mentioned being covered as well by the satellites for that whole constellation of satellites have been built not only singles is certainly a holy grail to really understand our activity as human, but also the nature and in temporary continuously manner because that’s the changes as he states in the very beginning, I driving our decisions on the daily level. So we want to know if they are changes before our door, but also on the other side of the road if you want to understand for example the economics of, of how people go back to aquaculture. The production in China for a certain crop is affecting the markets. You want to have this type of thing followed as continuous as possible.
Richard Jacobs: Okay. Is it far away or is it possible? Will it be possible soon again to image the entire earth all at once over a period of time? You know down to some reasonable resolution. I should have qualified, you know, like let’s say in in any particular spectrum, I guess there are different levels of it. So you know, the entire earth down to a one-meter accuracy, you know, in the visual and the visual spectrum where it’s allowable with cloud cover the entire earth, you know, and to ask me to accuracy in the thermal spectrum, I mean how far off are those abilities?
Benjamin Koetz: Probably. What’s the European space agency I doing every five days at 10 meters evolution so that existing already, and this is open and free for everybody in the commercial road is the company called climate. They have about hundred 20 small sets, cube sets, and they observed the roads per day and if he meets as a resolution, but it is not something that which you do at one point, we need to have a whole fruit. So 140 small satellites doing that and you have to stitch it up together, which in the end you don’t care about because you get this information and it’s not something that you do with one snapshot. So that is the hall of fame of moving. And if you want to have one meter, it’s a question of money in the end to invest. It’s technically possible and we just need to have a fleet of capabilities. As I said earlier, who do samples of the earth.
Richard Jacobs: Would there be any big benefits in being able to, do you know, the entire earth continuously? Would there be any benefits from being able to continuously, you know,
Benjamin Koetz: Well it depends on what process you want to look at. Some of these very frequent data we just talked about as being useful to, to monitor the changes, how often the Walmart parking lot is being frequented and make some of the analytics or that hold out the business off this one not happening. If you have, well I need to pay for that and you think this is valuable for you, for your business decisions, then this is a benefit.
Do you need to always think about what is your process you’re interested and you would come up with, there has been over the last few days if you use the huge, that’s the understanding what the monitoring and the temper and information dimensioned can bring to. And communities which we have not been talking to her on a regular basis. Then be talking to climate change scientists. That’s not necessary the title of the frequency of your needs. But if you talk to they are interested, it’s the oil that was nerves in a particular country is changing. We had to assess them high, very high-level positions at the lights. Okay,
Richard Jacobs: well very good. So, where can listeners, and I don’t know if there’s a public repository or a Biz, a level of public has access to some of these it images, some of the satellite data, but whether there is or isn’t, where can the public learn more and find out more about what kind of imaging is going on?
Benjamin Koetz: I mean, they did many of the satellite public available, some of the commercials so they are not necessarily for free. And there is what we call the CO’s observation satellites. It’s the organization of all space agencies around the globe and then you could tell specification the availability and the data that you can get them to download them. So that point you to this, let’s say they put a tray to understand why this exists.
Richard Jacobs: Yeah. Well, very good. Well, Benjamin, thank you for coming and you know, I appreciate you being on the podcast.
Benjamin Koetz: Thanks again for inviting and it was a pleasure.
Podcast: Play in new window | Download | Embed
SUBSCRIBE & REVIEW ON


SHARE THIS PODCAST


And get the Latest News from Finding Genius Podcast about Artificial Intelligence, 3D Printing, Regenerative Medicine. Blockchain, Virtual Reality and More.


